Business reports
The Reports form, accessed by pressing F11. This is used to create various reports, on a periodic basis.
Sales summary report
Expand this section to learn how to run this report.
- Press F11.
- Select Sales Summary in the upper right-hand corner of the form.
- Select 'Monitor' or 'Printer.'
- Enter the earliest date to include in the report.
- Enter the latest date to include in the report.
- If using departmentalization, select which department you would like to run the report for.
- Click on 'Produce Report.'
Information such as revenue generated in the period, jobs paid in the period and taxes collected in the period can be provided by this report. ServiceDesk reads directly from applicable records within the SalesJournal to produce this report, tabulates the results, and displays them to you.
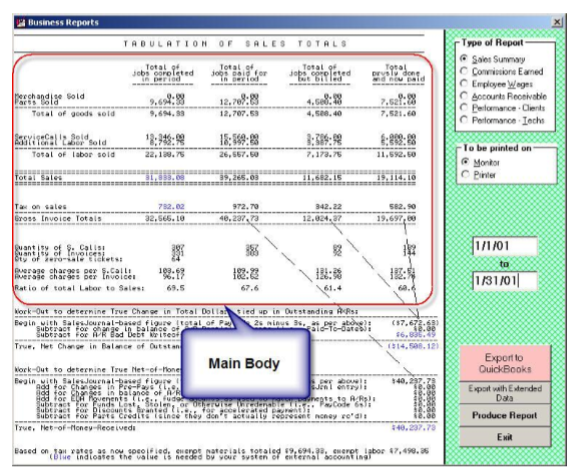
The main body of the report is divided into four columns (these columns are there for review if wanted, but it's typically the first or second that you'll pay most attention to).
- The first column tabulates the total of Paycode 1 and Paycode 2 SalesEntries and is intended to display totals for work completed during the period (regardless of whether paid or not).
- The second column tabulates the Paycode 1 and Paycode 3 SalesEntries and is intended to show the total work paid for in the period (regardless of when completed).
- The third column is the total of Paycode 2s.
- The fourth of Paycode 3s.
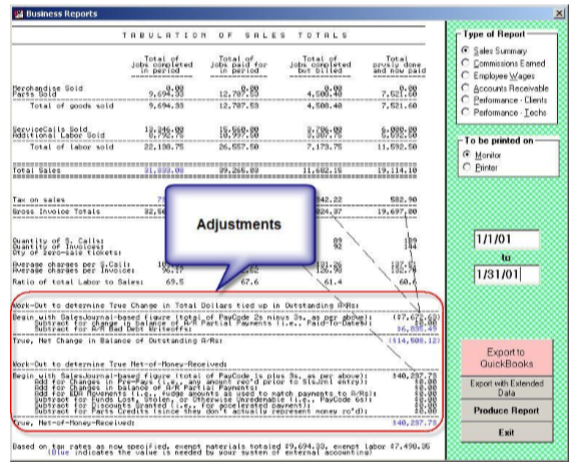
The second section contains information including a true total of money received, partial payments toward A/Rs, etc. To make the adjustments as applicable in this section (and arrive at the figures provided), ServiceDesk augments its reading of entries in the SalesJournal with the reading of entries in the Applications Journal.
There is an option to either display on-screen or print this report.
- If you select the option to print, you'll have an option to include line-by-line entries concerning each sale that went into the report.
- That option is not present if electing to display on-screen.
Several Export options are also associated with this report—accessible via buttons that appear when the report is displayed.
One matter of occasional confusion concerns the section in the report where there is a distinction between “ServiceCalls” and “Tickets.”
Each entry in SalesJournal represents a “ticket”. The intent is to classify the entry also as a “service call” if it is an entry reflecting in-field service (as opposed to POS activity) and if it's the first (typically only) such entry as applicable on a given job.
In other words, we want to exclude (as defined as “service calls”) entries if they involve going back (for recall or continuation work) after the initial work was supposedly completed.
The actual method that's used to achieve the above outcome is as follows:
- If the S.Call amount column in the SalesEntry is unequal to zero, the entry is tallied as a ServiceCall.
- If the Name column is in the form XX-Xxxxx (as in WP-Smith), and the Labor amount is at least $60, the system tallies the entry as a ServiceCall. The logic here is that it's common to leave the S.Call field blank and put all labor in the Labor field for warranty work. Thus, if from the Name field, it appears to be a likely warranty client, and from the amount, in the Labor field, it appears it was likely the entry on a job that reflected charging for the totality of the repair, the entry is tallied as an S.Call.
Accounts Receivable reports
Regardless of the type of A/R Report you choose, the underlying machinery reads its data directly from your A/R file —the same data that may be reviewed, on a record-by-record basis, in the A/R - Read form (the quick key is F3 ).
Standard summary
Expand this section to learn how to run this report.
- Press F11.
- Select 'Accounts Receivable.'
- Select 'Standard Summary.'
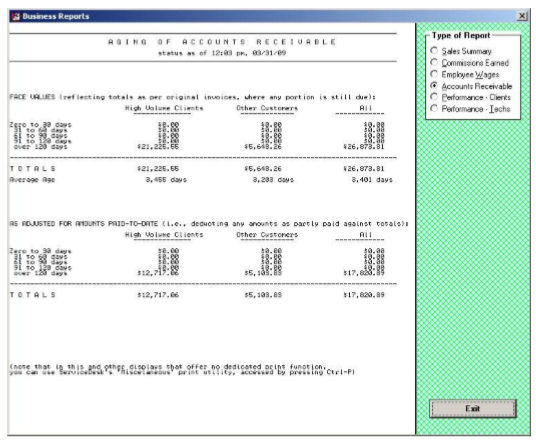
This report tabulates all your A/Rs as a group:
Breakdown by HVC
Expand this section to learn how to run this report.
- Press F11.
- Select 'Accounts Receivable.'
- Select 'Breakdown by HVC.'
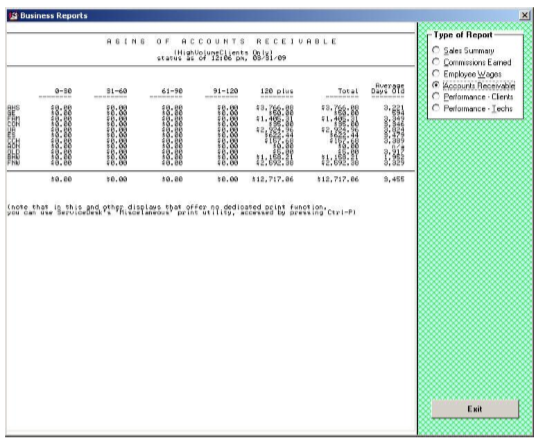
This report provides individual breakdowns per individual HighVolumeClients.
Payroll reports
Whether you pay your employees on a salary, wage or commission basis, it's nice to have help in tabulating each individual's earnings. ServiceDesk makes it easy, even almost automatic.
Your first step, in setting up ServiceDesk to calculate employee earnings, is to designate the type of earnings, and rate, for each person. For this purpose, use the RateOfEarnings form, accessed from the 'File Functions' section of the main menu or by pressing (Alt+F2). There is a listing for each person that's been entered, either as a 'Station Name' (i.e., it's an office person), or in the 'List of TechNames', from within the Settings form.
Click on the person whose type and rate of earnings you want to set (or review), then specify (or note) the settings accordingly. In regard to those technicians for whom you specify earnings based on commission, you can set independent rates for each category of sale (i.e., you can pay a particular percentage on Merchandise sold, something different on Parts, and so on for ServiceCalls and separate Labor).
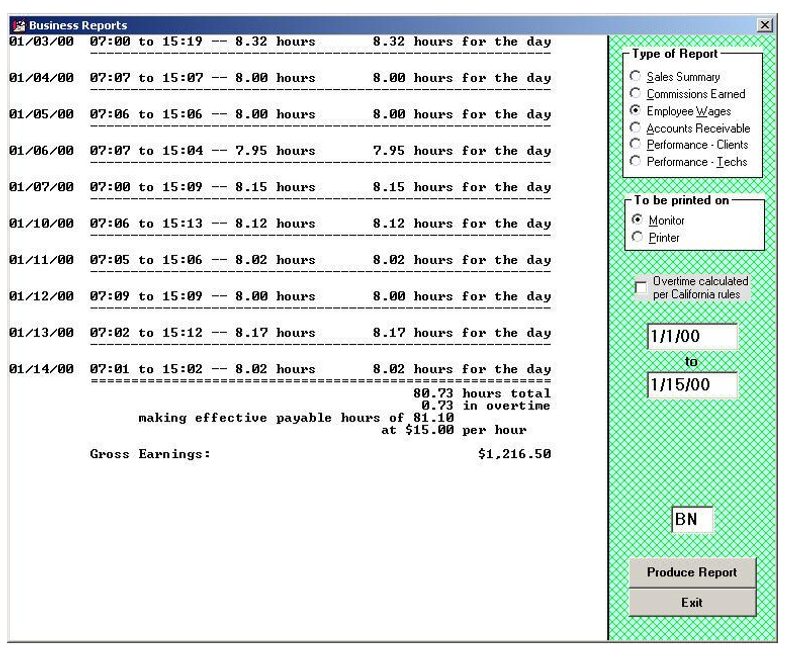
To create an actual salary, wage or commision report, select the desired feature from your Reports form (to access, press F11 or click on the indicated item in your main menu). You may note that, for purposes of selecting a report-type from within the form, if it's either a periodic salary or hourly wage report that you want, you must select the one option labeled 'Employee Wages' (ServiceDesk will make the distinction, between the two types, based on what you have specifically designated in your RateOfEarnings form). In this regard, you may note that, while there is no direct requirement for you to keep track of hours worked by a salaried employee (i.e., total earnings remain the same regardless of hours), we think it useful to maintain such information regardless. A salarytype report in ServiceDesk will, moreover, look for a history of hours logged by the employee, and report on those hours just the same as if he or she were paid hourly. The difference is that, rather than calculating a variable pay total based on hours worked, it will instead indicate the fixed salary rate, then calculate and report on what the salaried employee effectively earned per hour. We find it useful to track such information.
Wages
Expand this section to learn how to run this report.
- Press F11.
- Select 'Payroll.'
- Select 'Commissions Earned.'
- Select 'Monitor' or 'Printer.'
- Enter the earliest date for the period.
- Enter the latest date for the period.
- Enter the initials for the person whom you wish to report.
- Click on 'Produce Report'.
The next step is to compile the data to which the various payment types and rates will be applied. In the case of those employees paid hourly, this obviously means you need to keep track of their hours on the job. There is no reason you must do this from within ServiceDesk (a traditional, mechanical TimeClock still works very well), but for office personnel working at their own designated stations, ServiceDesk's built-in TimeClock feature is very convenient. Each such person can easily clock-in or out, simply by pressing F2 from his or her own station. ServiceDesk carefully logs each such event. Similarly, technicians can easily clock themselves, in or out of work, using the same feature—only in this context as accessed from their TechInterface form (a button to access the feature will appear whenever a tech, who's been designated for hourly pay, logs himself into the form; the button remains invisible to other technicians).
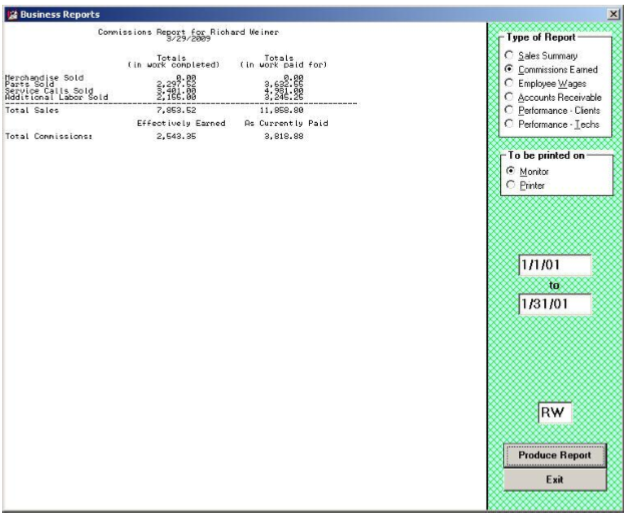
Commissions earned
Expand this section to learn how to run this report.
- Press F11.
- Select 'Payroll.'
- Select 'Wages.'
- Select 'Monitor' or 'Printer.'
- Enter the earliest date for the period.
- Enter the latest date for the period.
- Enter the initials for the person whom you wish to report.
- Click on Produce Report.
For those technicians paid on a commission basis, the relevant data (that which will underlie their pay) is already compiled, independent of any commission-calculating need. That data, of course, is precisely what's found in your SalesJournal (i.e., it shows every sale by every tech, broken into the categories of Merchandise, Parts, SCalls and Labor)—already compiled for purposes of plain record keeping, accounting, and so on.
If you pay any technicians both a wage/salary plus commissions, please note that your Reports form does not offer a combination report. Instead, if you want to show the hours an employee has logged on the job (and maybe calculate a portion of pay on such basis), do a wage/salary report. Then, do a separate Commission report to show and calculate that portion of pay.
Spiffs
Expand this section to learn how to run this report.
- Press F11.
- Select 'Payroll.'
- Select 'Spiffs.'
- Enter The earliest date for the period.
- Enter the latest date for the period.
- Enter the initials for the person whom you wish to report.
- Click on Produce Report.
- Select the preferred printer.
- Click 'Okay.'
ServiceDesk will compile a complete report for you (instead of leaving it up to you to put one together based on an export) to show what each applicable person earned during a particular earnings period for any special program you may offer.
The methodology for this report is:
- This report reads through each SalesJournal entry that fits within the date range you specify.
- It finds the credited tech under the entry.
- If it was the tech for whom the report is being compiled, it further looks to see what spiff items were checked for that entry.
- For any checked, it applies to the rules you set up and reports accordingly.
At present, ServiceDesk will not calculate and report on withholdings (basically, it only shows total pay for the period, and the underlying basis therefor). We formerly had plans to add this feature, but given the variations in payroll taxes from place to place (and the complicated means for calculating), we presently think the best plan is to have ServiceDesk make the basic earning reports for you, then you may use a dedicated payroll package (available at any office supply), or an outside professional payroll service, to do the rest.
Profitablity report
Expand this section to learn how to run this report.
- Press F11.
- Select 'Profitability.'
- Enter trip cost.
- Enter hourly cost.
- Enter The earliest date for the period.
- Enter the latest date for the period.
- Click on Produce Report.
This report lists each job as completed within a specific time frame, and each shows three simple figures (revenue, job cost, and resulting margin). The cost figure is based on a combination of parts used and labor inputs (figuring via user-provided inputs for per-trip and hourly costs for technicians).
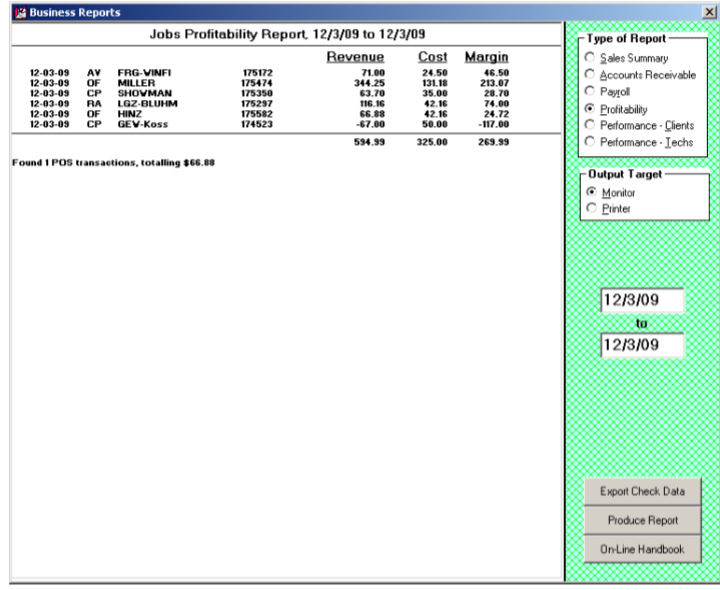
The underlying mechanisms are as follows:
- The system begins by looking, one by one, at each SalesJournal entry (Paycode 1 or 2) that fits within the user-specified date range. It tallies revenue amounts on this basis.
- For each such entry, it seeks to find a matching JobRecord.
- Suppose from the JobRecord it appears the sale involved a POS situation (the system looks in the job's historical narrative for the phrase "(POS context)"). In that case, the transaction is excluded from the main tally figures (in such a case, there will be a note at the bottom of the report that tallies POS items separately).
- It tallies the quantity of trips, on each job, by reading the narrative job history.
- It tallies time spent, on each job, by reading the narrative job history.
- It tallies the cost of parts used by searching for job-matching entries in the PartsProcess file, archived-PartsProcess file, and InventoryJournal (the quick key entries for direct review of these contexts are, respectively, F8, (Ctrl+F8) and F10 > Review-Purchases-and-Usage).
- It tallies LaborCost based on user-provided trip cost multiplied by quantity, then adds user-provided hourly cost multiplied by the time spent.
The underlying file, as simultaneously created when this report compiles for you, has added data breakdowns (separating parts cost factors from labor costs factors, for example). For such added detail, click on the button to open that file.
Performance - clients
Quality of service
Expand this section to learn how to run this report.
- Press F11.
- Select 'Performance - Clients.'
- Select 'Quality of Service.'
- Select 'Monitor' or 'Printer.'
- Enter the earliest date to include in the report.
- Enter the latest date to include in the report.
- If using departmentalization, select which department you would like to run the report for.
- Click on 'Produce Report.'
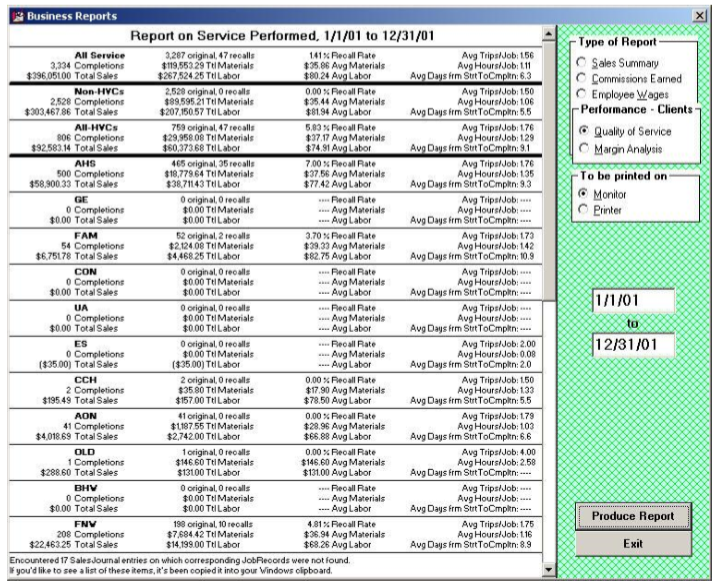
For those companies that do a lot of work for Home-Warranty type clients, there's a constant concern for keeping certain averages within prescribed limits. The reason is obvious: the client is itself watching these averages, and if your figures are not good enough, they may dispatch far fewer jobs to you. So you'd like to know how you're doing, and if maybe you're veering off in the wrong direction. Most importantly you want to know this before they do. This report (QOS stands for "Quality of Service") is designed to provide you with that information. Specifically, at present, it provides figures regarding Average Ticket and Recall Rate, separately calculated for each of your clients that are designated as ‘HighVolume' types.
Again, there are some details you may want to understand. As with Completion Analysis, this report looks exclusively to your JobsArchived file for its data. And, similarly, it reads the History section of each record that is reviewed there (again, you specify the quantity of records back that you wish to tabulate) to get its information.
In specific regard to calculating the Recall Rate, you should know that the system's sole means, for determining whether to classify a job as recall or not, is by looking within the job's Complaint/Request section (i.e., essentially the same text, unless later changed, as was typed into the equivalent box on the job's originating Callsheet). The system looks within the text there for the word "RECALL". If it finds the word, it counts the job as being in such category. Otherwise, it does not.
This obviously means that, if you are to have accurate tabulations in such category within this report, you must be consistent in assuring that this word ("RECALL") is placed in all job orders that belong in such category. Generally, we recommend that with any job that a Home-Warranty type client would classify as a "Possible Recall," you place these same words (or something similar, such as "POSS RECALL") in the Complaint/Request section. We know, many times such jobs prove to have been new, unconnected problems, but most home-warranty companies simply use that classification (or, rather, that of "Possible Recall") regardless, it it's simply for any job on the same appliance within 30-days of a previous repair. If you use the same rule in your company, and be sure that at least the critical part of the term ("RECALL") ends up in the Complaint/Request section of each such job's JobRecord, you'll have accurate reports in regard to how the home-warranty companies, at least, classify the matter.
The underlying mechanisms involved in producing the report are as follows:
- The system begins by looking, one by one, at each SalesJournal entry (Paycode 1 or 2) that fits within your specified date range. It tallies sale amounts on this basis.
- For each such entry, it seeks to find a matching JobRecord.
- Suppose from the JobRecord it appears the sale involved a POS situation (the system looks in the job's historical narrative for the phrase "(POS context)"). In that case, the transaction is excluded from the main tally figures (in such a case, there will be a note at the bottom of the report that tallies POS items separately).
- It determines whether to tally each particular job as a recall by using the “key-word” method (i.e., it looks for “RECALL”, “RE-CALL”, “CALLBACK,” or “C/B” in the job's Description/Complaint box).
- It tallies the quantity of trips, on each job, by reading the narrative job history.
- It tallies time spent, on each job, by reading the narrative job history.
- It tallies the quantity of days from start to finish, on each job, by counting the days between the job's OriginDate and the date of the last technician visit.
Margin analysis
Expand this section to learn how to run this report.
- Press F11.
- Select 'Performance - Clients.'
- Select 'Margin Analysis.'
- Enter trip cost.
- Enter hourly cost.
- Select 'Monitor' or 'Printer.'
- Select earliest date to include in the report.
- Select latest date to include in the report.
- If using departmentalization, select which department you would like to run the report for.
- Click on 'Produce Report.'
This report produces a series of figures (quantity of trips, the quantity of time, etc., as compared to revenue) designed to help you assess the profitability of work as connected to each of your HighVolumeClients, comparing between such parties and to your nonHighVolumeClient work (again, both at a group level and individually).
Please note that, for margin figures to be accurate, the user-query-provided trip-cost and hourly-cost figures must, in turn, be accurate. It raises the question as to how you arrive at such figures. We suggest running the report once using whatever seat-of-the-pants guess you wish for these figures. Run once; the report will provide the total trips and on-the-job hours for the period. Go to your financial accounting and find your total expenses for the period. Figure half the total expense as trip cost, and divide by quantity of trips to get per-trip-cost. Figure the other half as hourly/time cost, and divide by total hours to get hourly cost. Then rerun the report with these figures.
As another note, please observe that even if your provided cost-basis figures are inaccurate, you'll likely still have valid comparisons between one HighVolumeClient and another and between HighVolumeClients and non-HVC work.
The underlying mechanics are as follows:
- The system begins by looking, one by one, at each SalesJournal entry (Paycode 1 or 2) that fits within the user-specified date range. It tallies sale amounts on this basis.
- For each such entry, it seeks to find a matching JobRecord.
- If from the JobRecord it appears the sale involved a POS situation (the system looks in the job's historical narrative for the phrase "(POS context)"), the transaction is excluded from the main tally figures (in such a case, there will be a note at the report bottom that tallies POS items separately).
- It tallies the quantity of trips, on each job, by reading the narrative job history.
- It tallies time spent, on each job, by reading the narrative job history.
- It tallies the cost of parts used by searching for job-matching entries in the PartsProcess file, archived-PartsProcess file, and InventoryJournal (the quick key entries for direct review of these contexts are, respectively, F8, Ctrl, + F8, and F10 > Review-Purchases-and-Usage).
- It tallies LaborCost based on user-provided trip-cost multiplied by quantity, then adds user-provided hourly-cost multiplied by the time spent.
Performance metrics
Expand this section to learn how to run this report.
- Press F11.
- Select 'Performance - Clients.'
- Select 'Performance Metrics.'
- Enter WP's HVC-Abbreviation.
- Enter the earliest date to include in the report.
- Enter the latest date to include in the report.
- Click on 'Produce Report.'
A report specifically tailored to, as near as possible, match several of Whirlpool's focused metrics, including separation between average days to completion on jobs with parts (and this is indeed from dispatch to completion) versus average on jobs without parts. It will only show such indications based on the specification of the underlying client and not on basis of whether it's a job (regardless of the client and regardless of whether it was COD or not) that was dispatched to you by Whirlpool.
Reconcile WP OOW Fees
Expand this section to learn how to run this report.
- Press F11.
- Select 'Performance - Clients.'
- Navigate to the location of your saved file.
- Press 'Okay.'
This report is for servicers who accept COD referrals from Whirlpool in exchange for paying Whirlpool a $15 referral fee.
Whirlpool provides reports in an Excel spreadsheet detailing the items for which it charges a referral fee.
This feature will open that report, examine each line item, find the matching JobRecord within ServiceDesk, and add five columns into Whirlpool's report that provide information regarding each item -- including the ServiceDesk JobRecord Number, start and end dates, who was the paying party (i.e., Whirlpool or the consumer), what was the total sold, and whether the historical notes indicate you've already prior paid the referral fee.
We italicized the expression "whether historical notes indicate . . ." The reason is that ServiceDesk has no mechanism to explicitly and directly track whether you've paid the referral fee on any item. In the absence of this, many users have made it a practice, when paying WP referral fees, to add a little note into each applicable JobRecord with text such as "Paid WP referral fee" or "Paid $15 fee." This is the type of text that this reporting mechanism is looking for. Specifically, it is looking within each applicable JobRecord narrative for the text strings "Paid WP" or "Paid "$15". If it sees either such textual string, it will, in that fifth added field, indicate that "Yes," it found the indication. Otherwise, it will indicate "No."
Performance - techs
Result on Dispatches Report
Expand this section to learn how to run this report.
- Press F11.
- Select 'Performance - Techs.'
- Select 'Results on Dispatches.'
- Check the 'Include Shop Jobs' box if you want to include shop jobs.
- Enter the earliest date to include in the report.
- Enter the latest date to include in the report.
- Click on 'Produce Report.'
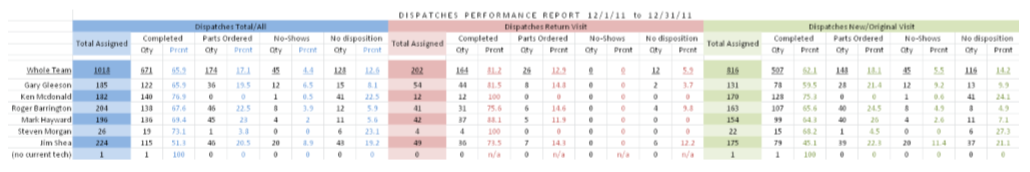
This is one of our newer Technician Productivity reports (introduced in January 2012). Its purpose is to provide some fairly raw numbers showing what each tech has done with the dispatches given (i.e., how many resulted in completions, how many in part orders, etc.).
The report's output loads into Excel, which takes advantage of greater width availability than can display well in this manual. Nevertheless, here's a shrunken image to give you some idea of what's involved:
The report's methodology is as follows:
- This system reads within your Archived-ScheduleList, finding all appointments within the requested date range.
- It iterates through that set of appointments, once for your operation as a whole, then for each tech in your current roster, then for any appointments with no tech assignment or whose assignment is to other than a current-roster tech.
- As it works with each particular appointment, it uses the appointment's CheckOff symbol to deduce whether the appointment should be deemed the job having been “ Completed ” (Heart symbol), in a customer “No-Show” (Diamond symbol), or otherwise.
- Suppose the CheckOff symbol is otherwise (i.e., not a Heart or Diamond symbol). In that case, the system examines the narrative history within the applicable JobRecord (assuming the same can be found, which in virtually all cases should be true) to see whether parts were ordered; if so, the appointment is scored in the “ Parts Ordered ” category). If in this mode (i.e., the appointment did not have either a heart or diamond symbol) and there is no evidence in the narrative history that parts were ordered, the appointment/dispatch is scored within the “ No disposition ” category.
- The system iterates through per above three different times. First, it does it for all appointments (blue section in the above-illustrated output). Then it does for appointments that, based on the system looking in each item's relevant JobHistory, it can deduce had a prior-fulfilled appointment (pink section in the above-illustrated output). Finally, it does it for those appointments where there was no basis, upon reading an applicable JobHistory, to conclude that there had been prior appointments (green section in above-illustrated output).
- Based on the quantities and percents as tallied via each of the above-described iterations, the system enters the resulting data into an Excel spreadsheet in the pattern as shown above.
Percent of completion
Expand this section to learn how to run this report.
- Press F11.
- Select 'Performance - Techs.'
- Select 'Percent of Completion.'
- Select 'Monitor' or 'Printer.'
- Select earliest date to include in the report.
- Select latest date to include in the report.
- Click on 'Produce Report.'
A major concern for any service-call-performing company is to complete each job in as few trips as possible. Many times, when owners of such companies gather, you'll find them discussing the rate of "first time completions" each has managed to maintain within his or her company. This is the report that will calculate that figure for you. Actually, it has several breakdowns, and provides figures not just company-wide, but as to each technician as well. The latter figure is very useful, of course, for spotting which technicians are weak, in terms of completing jobs on the first trip (or second at most), and helping them improve.
There are couple of details you may want to know in regard to how these reports are compiled. Basically, the system looks exclusively at jobs that have already been moved into the JobsArchived file (as many back as you wish to tabulate for). It examines the 'History' section of each such job, and deduces how many trips were made by looking for key words that so indicate. Specifically, it looks for the beginning of the kind of entry that's made each time there is a PostVisitReport on a job (i.e., something like '11/17/99 8:44 DS there 16 Tues 1.30 to 3.05, . . .). It counts the number of such entries within each reviewed item's history, and scores that as the number of trips involved. When segregating numbers between the various techs, it's the tech who's on record as making the first trip who gets assigned all numbers pertaining to the job in question.
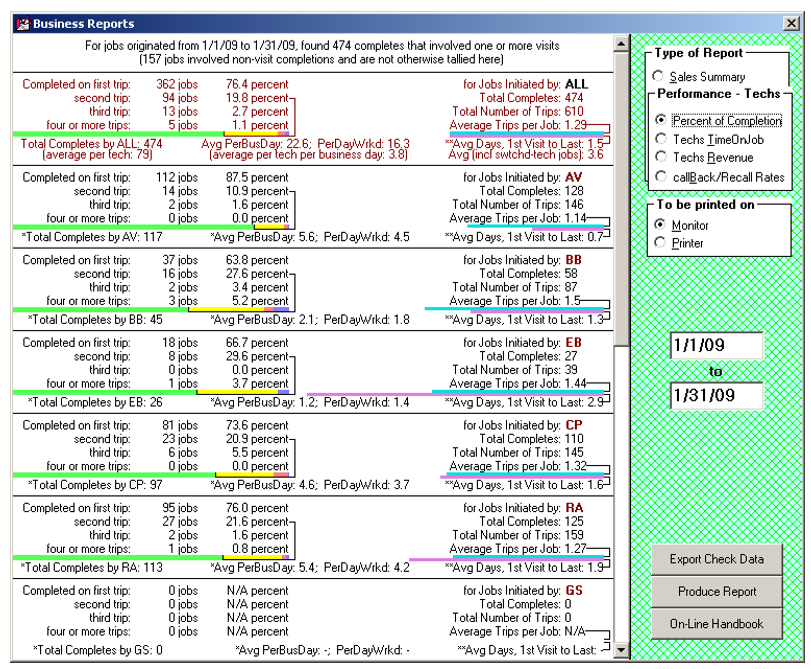
Please note how the leftward graph allows you to visually compare (and at a glance) how your techs are comparing regarding needing more than one trip or not (you can easily see via comparative green/yellow/red bands, for example, that BB is comparing poorly). The two rightward graphs (cyan and violet) similarly allow an at-a-glance comparison of how the techs compare on average trips-per-job and average days from start to completion.
In the case of all graphs, it's also easy to compare with company-wide averages and numbers, as shown in the top/red section. Indeed, you can think of the company-side values as providing a “par” figure against which each tech can be compared.
Methodology for this report is as follows:
- The system reads within your archived JobRecords, beginning at the most recent and working toward the oldest.
- It continues reading in such succession until having either: (a) reached record position 1; or (b) encountered a weighted-basis quantity of records that are older than your specified date range.
- Whether a job fits within the specified date range is based on its OriginDate.
- For each job within the date range, the system tallies the quantity of visits by reading the narrative history.
- For the main section, as applicable to each tech, it determines which tech the job should be credited to by looking, in the narrative history, to see which tech was there first. The theory is a different tech might be called upon to finish a job that a less competent one failed to (but should have) finish with fewer trips. It's not the tech who finished, but the one who should have finished earlier that should be charged with multiple trips.
- The little final-line section, as applicable to each tech (i.e., showing Total Completes and Avg Completes/Business Day ), concentrates instead on the last tech who performed on the job. It would not seem sensible to credit a mere initiating tech with job completions.
- For the last figure in that final-line section (i.e., showing Avg Days from Start To Finish ), the system tallies only those jobs where the same tech was there for both the first and final visit. The thinking here is that, for such a figure, if different techs were involved, tally this figure to either of them.
- Please also note that, regarding that final figure (showing Avg Days from Start To Finish ), we are counting days between the first visit and the final visit —not between the date the job was written and the final visit. Since this is a measure of technician performance, there is no reason to include the time between when the customer requested service and the date of the first visit.
For Average - Completes - Per - Business - Day, please note that the first figure is derived from a five-day work week. In other words, the system looks at the date range involved and figures how many standard weekdays (Monday through Friday) fit within that period. Based on that figure, it calculates the quantity of standard “business” days, using that figure as the denominator to calculate completes (for the technician who did the complete) per such standard business day.
Regarding Average - Completes - Per - Day - Worked, by contrast, the system's method is to count, as a day worked by any particular, any day in which there's an entry in an applicable JobRecord showing that he completed a work visit, on a job, on that day. No others days are counted. For the operation as a whole (i.e., “ALL” in the tally), any day on which any tech worked (according to the above-described criteria) is counted as a work day.
Based on the above, you may note some interesting comparisons. Some of your techs may show higher completes per business day than per day worked. For those, it's evident they must have worked more days than are involved in the measure of standard business days. Other techs may show higher completes per days worked than per business day. For those, it should be evident that they worked fewer days than are involved in the measure of standard business days for the period in question. Another interesting factor; you'll likely find less variation, among the techs, in completes per days worked, as opposed to completes per business day.
Techs time on job
Expand this section to learn how to run this report.
- Press F11.
- Select 'Performance - Techs.'
- Select 'Techs Time on Job.'
- Select 'Monitor' or 'Printer.'
- Select earliest date to include in the report.
- Select latest date to include in the report.
- Click on 'Produce Report.'
Still another major concern for any company that's concerned about quality service is to monitor how well each technician is doing in terms of arriving within prescribed time limits at the customer's home. And, to partially gauge his efficiency, there's also an interest in knowing how long he's spending, on average, after having arrived.
Information regarding these matters is provided by the Tech Time Analysis feature of the Reports form. Simply select that option from the form and, as with the related reports, indicate how many records back (within the archived job record) you wish to search. As you'll see, the resulting report provides a treasure trove of information regarding the matters above-referenced, and related ones.
Again, bear in mind that, as with the cousin reporting methods above-described, this report actually reads through job histories in order to glean the information that it compiles. This means the fundamental information has to be there in the first place, based on accurate PostVisitReports having faithfully been made by you and your people. And it means that it takes a while for the report to be generated (reading through those histories takes time, even for a computer) if you select a very large number.
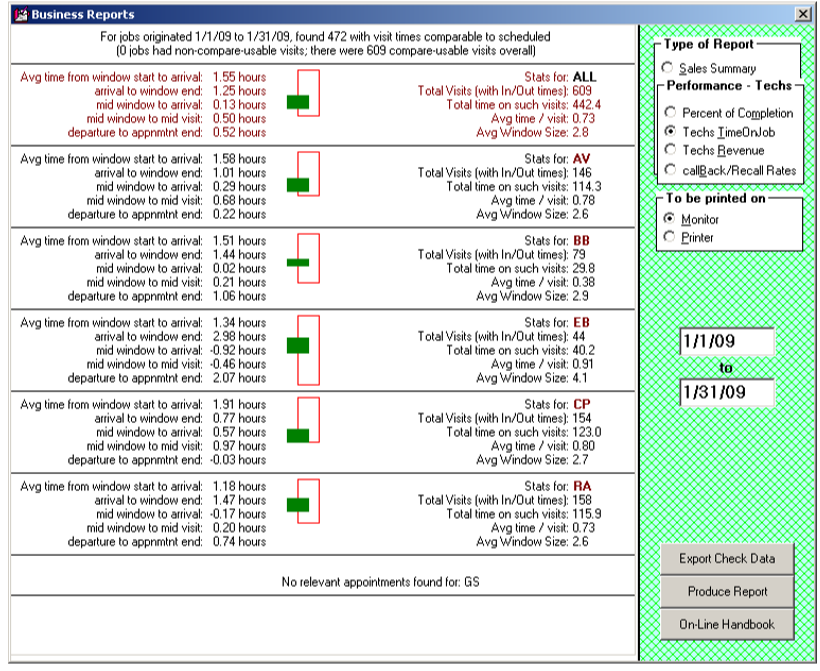
Please note the graphic provided in each section. The red rectangle is intended to denote the average window size (i.e., of the appointment window for which the tech is scheduled). The green box denotes the average time the tech spends per job and where it fits within the larger appointment window.
For example, you can tell at a glance that CP (above) is doing poorly regarding where he's positioning his on-site times compared to appointment windows. BB, on the other hand, is doing much better, and he's also very quick (short time on each job). EB is doing the best in terms of having his on-site time toward the front of appointment windows. On the other hand, he is being given much larger appointment windows (as compared to the other guys) to work with.
Please also note that the top/red section shows figures and graphs for the operation as a whole. This provides a “par” standard against which individuals may be assessed, but it's also a useful measure of the company. In this case, a glance at the company-wide/top-section graphic shows that, overall, tech on-site times are quite late compared to appointment windows. Knowing how much customers appreciate having techs on-site early within their appointment windows (and hate it otherwise), this is something that, as an owner/manager, I'd strongly want to address.
The methodology for this report is as follows:
- The system reads within your archived JobRecords, beginning at the most recent and working toward the oldest.
- It continues reading in such succession until having either: (a) reached record position 1; or (b) encountered a weighted-basis quantity of records that are older than your specified date range.
- Whether a job fits within the specified date range is based on its OriginDate.
- For each job that fits within the date range, the system looks in the narrative history to find entries that: (a) describe a tech's visit; and (b) include his start and end times. (Please note, if there are “ XX rsppndd ”-type entries that do not include start and end times, these will not be included in this report).
- For such entries as found, the system looks to a preceding entry describing the scheduled time frame.
- Upon finding any such appropriate pairing (i.e., one entry describing the time frame scheduled and another describing the times when the tech was actually there), the system then tallies appropriate comparisons and compiles for presentation in the report.
Techs revenue
Expand this section to learn how to run this report.
- Press F11.
- Select 'Performance - Techs.'
- Select 'Techs Revenue.'
- Select 'Monitor' or 'Printer.'
- Select earliest date to include in the report.
- Select latest date to include in the report.
- Check the box labeled 'Limit to HVC's' if desired.
- Click on 'Produce Report.'
This report produces a set of figures to help you determine how well each is doing in terms of producing revenue. The results are based on a comparison basis between technicians,
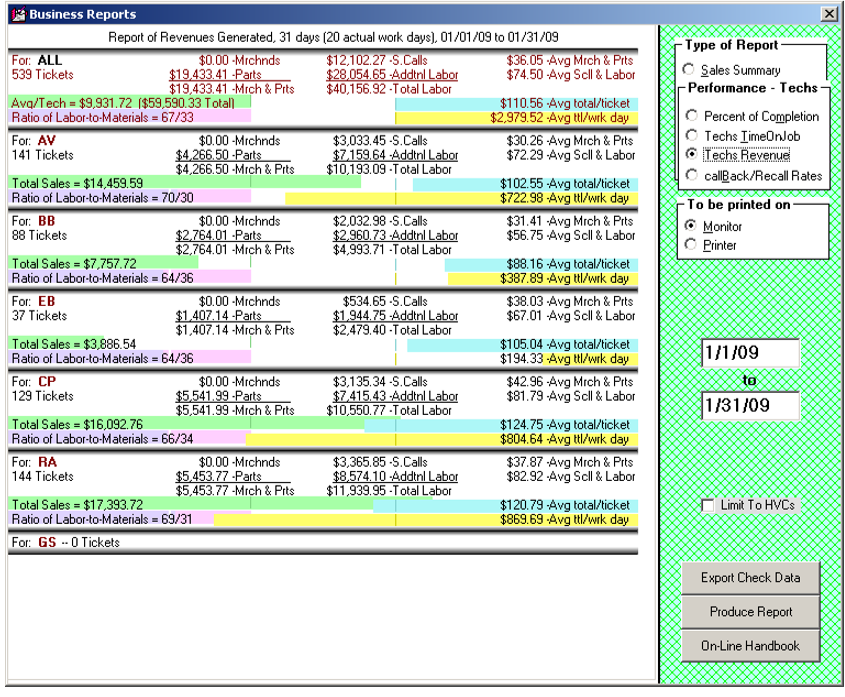
There is, again, a top/red section for company-wide values and a selection of graphics to help with at-a-glance comparisons. In particular, the top section provides company-wide (or ”par”) geometries for each measure, with each tech’s particular measure purposely arranged to allow easy direct comparison. At a glance, for example (green graphs), you can see that three of the techs (RA especially) are performing well above par regarding total sales. Their average workday totals (yellow graphs) mirror the same fact. However, one of the techs with strong total sales is not so strong in average total-per-ticket (AV, blue graph).
The leftward purple/violet graph is particularly interesting in its ratio-type comparison between labor and materials sold. This graph in AV’s section may give an immediate clue as to why his average total per ticket is below par. It appears, simply, that in comparison to others, he is underselling on parts. Perhaps that is all he needs to amend.
The methodology for this report is as follows
- The system reads your SalesJournal file and determines the range of entries that fits within your date-range specification.
- Each entry within that range uses the Technician field to determine the tech to whom the sale should be attributed and tallies accordingly.
Callback reports
Two methods are provided because, as a design matter, we want to avoid imposing on users the burden of making a human-based judgment, in every potential instance, as to whether a job should properly be classified as a recall. We think that is (or would be, if required) a nasty burden, particularly since it's fraught with the potential of time-consuming (and emotion-taxing) arguments with technicians, etc. We think it's better to have a system that allows valid comparison of recall rates between techs, even knowing the absolute numbers will likely include some percentage of instances charged as recalls inappropriately.
If you don't use the UnitInfo system with regularity, the keyword method can be your solution. If you don't insert the keywords when creating jobs but use the UnitInfo system with reasonable religiosity, that method can be your solution. Or, you can use and compare both.
The first strategy requires no separate effort on your part whatsoever, so long as it is your normal practice to create UnitInfoSheets in connection with most every job.
The second requires that text within the JobRecord be setup in a way that ServiceDesk is able to read the text and thus recognize the job as a recall (or at least possible recall) on the basis of the text itself. Since computers don't have any true IQ, you have to arrange the text in a particular manner to help ServiceDesk in this “reading” process. Specifically, you should do one of two things: either (a) manually type the word “RECALL” (“RE-CALL” is also okay) within the Description section of any job that potentially is a recall; or (b) insert the info-set to your Callsheet from the previous job using the “oriented-for-recall” method of insertion.
Regardless of which strategy you choose, to create a report simply go to the Reports form F11, choose 'Performance Analysis', then select the 'Callback/Recall Rates' option. You're then offered the choice of which method to use in compiling your report. If you've consistently been UnitInfoSheets to your jobs, the first method should give you pretty good numbers. If you've been placing the word “RECALL” into the Description section of jobs that were potential recalls, the second method should give you pretty good numbers. If you've done both, try both reports and see how they compare.
One suggestion. When using the resulting numbers with your techs, you'll likely need to educate them on the fact that you realize there's some proportion of the numbers generated that do not represent true recalls. You'll have to educate them to the fact that it's just not practical to make and tally judgments on a job-by-job basis, but that all techs should, presumably, suffer from the same rate of “false” recalls (i.e., being called back on the same machine within 30 days even when the first repair was done perfectly). Thus, even if the figures are, say, 10 percent too high for all techs, it's the comparison between techs that matters—and if one tech is significantly higher than the others, he is just plain that—since any inflation from false recalls should affect all equally.
In this last regard, please note that the two examples in this section are for the same company and from the same data. Interestingly, overall recall percentages are larger in the Key-Word method report. However, comparisons between the techs remain constant. Look and compare; you'll see.
UIS method
Expand this section to learn how to run this report.
- Press F11.
- Select 'Performance - Techs.'
- Select 'Callback / Recall Rates.'
- Select 'UIS Method.'
- Enter the quantity of days to use as a standard.
- Select earliest date to include in the report.
- Select latest date to include in the report.
- Click on 'Produce Report.'
This report gives the total quantity of jobs for each tech, the total classified as recalls, and a resulting recall percent figure. It also provides graphs to provide an at-a-glance sense of comparison. The horizontal aspect of these graphs is obvious. The varying thickness of each graph may not be. The thickness varies simply to provide a visual indicator of comparative quantities of work being done. If Tech A has a slightly higher recall rate than Tech B but is doing twice as much work, it may not seem as bad as otherwise.
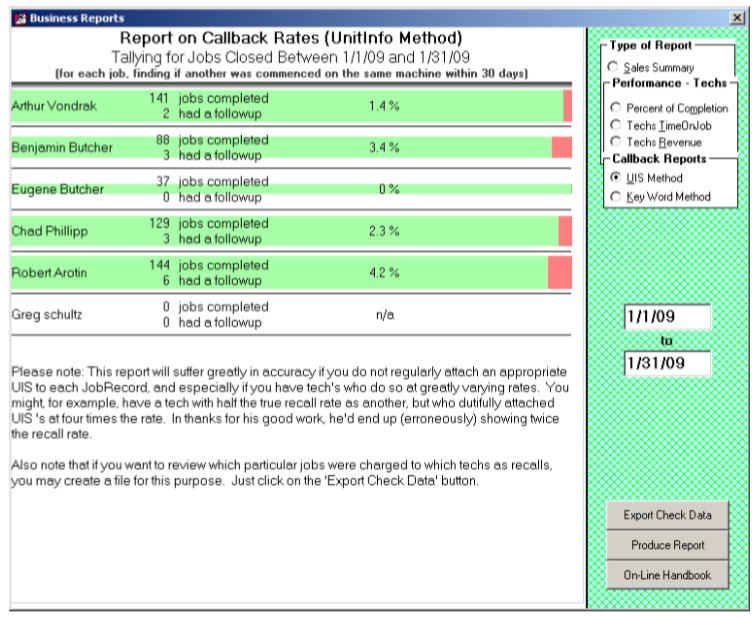
Its underlying theory is that if your company was called back to service the same underlying machine again within 30 days of a previous (and supposedly complete) job on that machine, there's a pretty good chance the earlier work was not sufficiently complete or perfect. We automatically classify any within-30-days-of-a-previously-completed-job situation as a recall, though we know some are not. Sure, the figures might be a little higher than actual guilt in our technicians' work. However, in the absence of any good reason why one tech should suffer greater such inflation than another, the figures remain totally valid for comparison purposes.
To illustrate, let's suppose (simply for argument's sake) “2 percent” happens to be the rate at which you get new jobs on the same machine within 30 days of a previously completed job—and for reasons not related to inadequacy in a tech's prior work. In other words, that's the “innocent” rate. Tech A shows on the report a 4 percent recall rate, and Tech B shows a 5 percent. As far as true/guilty rates are concerned (i.e., jobs where you had to go back because of inadequacies in prior work), it's easy (given our assumption of an innocent base at 2 percent) to deduce real numbers for both at 2 and 3 percent, respectively (i.e., after subtracting the innocent base).
However, the subtraction is unnecessary (and you likely don't know the innocent base, regardless). Looking solely at the raw numbers, it's apparent Tech A is performing better -- in terms of getting it right the first time -- than Tech B. That comparative basis is what you most need.
The methodology for producing this report is as follows:
- The system finds the section in your SalesJournal containing sales entries fitting the specified date range.
- It reads through each item to see if the UnitInfo table has a UIS record attached to the applicable InvoiceNumber.
- If yes, it looks to see if the same UIS record is also attached to a more recent ticket. If so, it opens and examines that ticket (if there are multiple more recent tickets, it's solely the next -more-recent one that it checks).
- In that examination, it looks to see if the origin date on that more-recent ticket is within 30 days of the closing date, as involved in the originally-found entry from the SalesJournal.
- If so, it figures: “Aha, I've got an ostensive recall.”
- It then tallies the information, charging the “recall” to the tech credited with completion in the first-found SalesJournal entry.
In the present strategy, the system looks at jobs closed within your specified date range and, for each, looks downward in the data, seeking to find if there was a subsequent job within the specified number of days and on the same machine. In the old strategy, it looked to find jobs that originated within your specified date range, and for those looked upward in the data seeking to find if there was a prior job within the specified number of days and on the same machine.
There are significant consequences in this distinction. With the old method, the guilty work reported (i.e., jobs performed by techs where new work was needed thereafter) was offset 30 days prior in time as compared to your specified date range. Thus, you were determining how your techs performed, recall-wise, 30 days before your date range. Though slightly weird, it was an inherent consequence of the method's structure. One benefit was there was no impediment against picking a date range, including dates right up to the present.
With the new structure, that offset is eliminated. It produces results showing guilt as precisely pertaining to your specified date range. But again, there's a downside. Here it is not practical to pick a date range that is not at least 30 days before the present. The simple reason is there have not yet that quantity of days -- to see if a new job comes up within that period.
Please note that after this report compiles, a button appears in the form (labeled 'Export Check Data') that allows you to create a file that lists the jobs being charged, to each respective tech, as recalls. This is needed when you have that particular tech who denies there is any possibility they had so many recalls. For that situation, you can use the list to go through each and every item with them, proving that each fits the design criteria. Sometimes you have to prove to a tech that improvement is needed—before they believe improvement is needed.
Please further note the methodology in this report fundamentally depends on the faithful creation and attachment of UnitInfo sheets as applicable to each job. If it is not your practice to do this, the entire basis of this report fails—and you'd better consider using its alternative instead.
Keyword method
Expand this section to learn how to run this report.
- Press F11.
- Select 'Performance - Techs.'
- Select 'Callback / Recall Rates.'
- Select 'Key Word Method.'
- Enter the quantity of days to use as a standard.
- Select earliest date to include in the report.
- Select latest date to include in the report.
- Click on 'Produce Report.'
This method relies on the keywords being present in the Desciption/Request box:
- RECALL
- RE-CALL
- CALLBACK
Alternatively, it will also look for 'C/B' toward the end of the CustomerName box (this can be inserted by performing a CTRL + RightClick on a CustomerDatabase search return in the Callsheet).
This is the second of two recall-rate reports. Again, two methods are provided because, as a design matter, we want to avoid imposing on users the burden of making a human-based judgment in every potential instance as to whether a job should properly be classified as a recall. We think, in short, it's better to have a system that allows valid comparison of recall rates, even while knowing the absolute numbers will likely include some percentage that is charged as recalls inappropriately.
As you'll see by comparing to the report produced via the Unit-Info method, the display method on this report is all but identical.
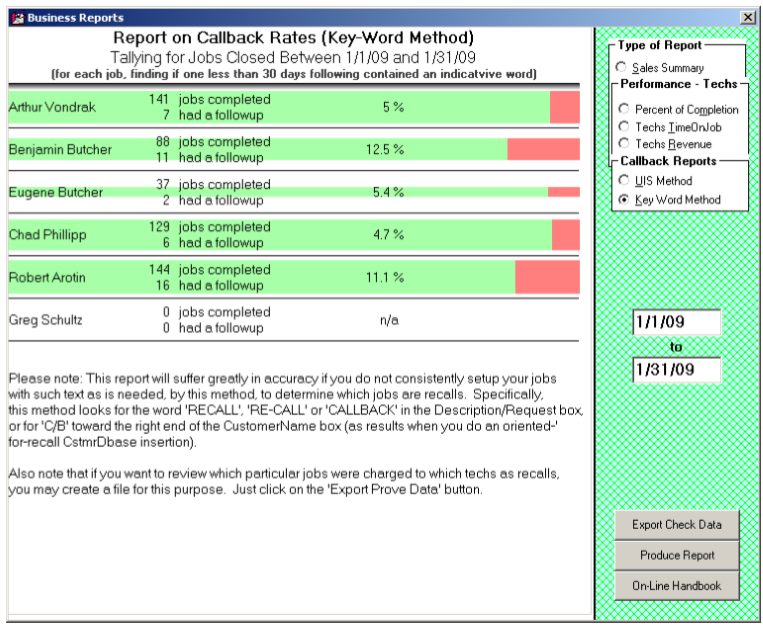
It's the method that varies.
The underlying theory in this report is that, when a consumer calls requesting service on the same equipment as was recently serviced, he or she typically makes a point of saying something along the lines of: “The tech was here just last week, and it's still not fixed.” Your call-taker should have right in front of them information (automatically provided by ServiceDesk as they type the consumer's name) as to which tech performed that prior work. If to do so, they'll type something in the Callsheet's Description/Complaint box similar to the following:
STILL LEAKING, DAVE WAS THERE LAST WEEK AND REPLACED DOOR SEAL, POSSIBLE RECALL
This report depends on your call-takers maintaining such a practice. It looks for the word “RECALL” (or any of several potential variants) in the Complaint/Description box and tallies jobs as recalls accordingly.
Specifically, the methodology is:
- The system finds the section in your SalesJournal containing sales entries fitting the specified date range.
- It reads through each item and looks in your CstmrDbase Address index for any following jobs at the same address.
- For any such following jobs as it finds, it looks to see if the underlying JobRecord Type and Make fields are the same as with the originally found entry
- If the above checks as true, the system next looks to see if the following jobs contain any of those magic keywords.
- If that proves true, the system checks to ensure the following jobs did not originate more than 30 days (or other user-specified quantity) after the underlying job was closed.
- If that last check proves valid, the system figures: “Aha, I've got an ostensive recall.”
- It then tallies the information, charging the “recall” to the tech credited with completion in the first-found SalesJournal entry.
Much like the Unit-Info method (please see discussion there), this one, too, reverses the direction from which recalls are approached. In other words, instead of looking first for jobs (fitting within a specified date range) that might potentially be the actual recalls, then delving deeper into the past to find the originating jobs that preceded them, this one looks for originating jobs within the specified date range, then looks to see if following ones might be recalls.
Just like the Unit-Info method, it changes how you view the date range.
We have a word of advice regarding using the phrase “POSSIBLE RECALL” or similar. We highly recommend using the word “POSSIBLE” for several reasons:
- It assures the customer you recognize it might be a recall situation, but that determination has not been reached until after the present situation is fully diagnosed;
- It assures the technician you're not making an advance judgment that might improperly impugn his prior work; and
- It can have on-its-face recognition that, whereas this report is going to tally as “recalls,” all jobs that are found with such a key-word in their respective Description/Complaint boxes (and within a specified quantity of days), some particular percentage (unknown, but presumably the same for all techs) will be not-true-recall situations.
If, incidentally, you are concerned about your customers seeing the phrase and concluding on its basis that they simply should not be charged the second time around, if anything, the opposite is more likely to occur. By placing the phrase within the ticket, you're demonstrating to the customer your complete willingness to be upfront on the issue. If the technician finds there's a new, unrelated problem, the existence of that phrase on the ticket proves the company had been ready and willing to consider it a recall—which makes it more credible when and if the tech happens to find otherwise.
In short, if you wish to use this method, teach your call-takers to put in an appropriate phrase in appropriate instances consistently. Specifically, be sure they use the word “RECALL” or one of its accepted variants, and (for the sake of the above-described sensibilities) to also always use the word “POSSIBLE.”
Just as with the UIS method, this may produce numbers somewhat higher than a technician's actual guilt. But again (mirroring the same dynamic), so long as there's no reason why the rate of such “false accusations” should be different for one tech than for another, the report remains very valid for comparison purposes.
In another parallel with the UIS method, this one also shows a button on the form (labeled 'Export Check Data') that allows you to create a file that lists the jobs charged to each respective tech as recalls. If you need to see it, just click on the button and follow the prompts.
Time allocations (DTR)
Expand this section to learn how to run this report.
- Press F11.
- Select 'Performance - Techs.'
- Select 'Time Allocations (DTR).'
- Select earliest date to include in the report.
- Select latest date to include in the report.
- Click on 'Produce Report.'
- Save the export.
This report allows an analysis of how each tech spends his time, particularly how much is spent while “booked-in” at job sites, compared to his total time “on the clock.” It can also reveal typical time lapses between time-clock punch-in and arrival at the first job, a departure from the last job and time-clock punch-out, etc.
The report's output loads into Excel and, on that basis, take advantage of greater width availability than can display well in this manual. Nevertheless, here's a shrunken image to give you some idea of what's involved:
The report's methodology is as follows:
- This system reads within your Archived-ScheduleList, finding all appointments within the requested date range.
- For each such appointment, it finds the tech involved and their start and end times when fulfilling the appointment.
- Based on the above, the system assembles for each tech a list of all appointment time-spreads as involved in each applicable day, as encompassed within the report. For each such day, it further looks in the tech's TimeCard file to compare the time (or periods) in which they were time-card punched in. It is based on these comparisons that the numbers are compiled.
Please note this report has a close relative in the DTR-Viewer as available from within the DispatchMap (F5) when viewing past days. More particularly, if you keyboard press Alt-D while viewing any past day there, the system will view a graphic for each tech that shows the hours they were on the clock and the portion of all such hours that they were logged in on actual jobs.
Inventory deployments
Expand this section to learn how to run this report.
- Press F11.
- Select
- Select 'Performance - Techs.'
- Select 'Inventory Deployments.'
- Select 'Monitor' or 'Printer.'
- Select earliest date to include in the report.
- Select latest date to include in the report.
- Click on 'Produce Report.'
When appropriately using ServiceDesk's Inventory Control system, you should periodically be conducting physical inventories. These tallies will be used to compare the quantity of stock at each location to ServiceDesk-indicated stock and then adjust quantities as reckoned by ServiceDesk to fit what is physically found.
All but inevitably, there will be at least a few discrepancies, and often they are for near-innocent reasons. For example, an otherwise excellent tech forgets to list a minor part that they used (if they don't indicate its use, the system cannot know it should decrement the reckoned quantity). Potentially, the opposite might occur. Less excellent techs might make such mistakes more often and more grossly (i.e., forget to indicate the use of major and expensive parts and do so with significant frequency).
Of course, not all cases are innocent at all. Some may be nefarious indeed, as when a tech is doing their own work independently and is using your parts on their jobs! (Most service company owners who have employed a significant number of techs over a significant period have seen this happen.)
Besides doing periodic physical inventories, another process that facilitates registering discrepancies is when a tech indicates they used a part from stock that the system did not reckon they had or when they tell you they have no stock on an item the system reckons they should have. In either case, the system accommodates ad hoc adjustment to reckoned inventory to make it equal to the evident physical reality.
Regardless of the process for making adjustments, an entry is always recorded to reflect the fact it was required (it's made to the "Journal of Inventory Movements"). One of our notions in such connection has been if you suspect a tech of potentially having been overly careless (or perhaps even nefarious) regarding such inventory items as are entrusted to them, you may review such adjustments as have been required. On that basis, you can make a judgment as to what is probable in such regard.
The problem is it's a bit painstaking to review these journal entries to form a coherent picture. It's more painstaking, still, if you want to compare between and among your techs. So, we provide a report that provides information you can review for this purpose.
Performance - office
Expand this section to learn how to run this report.
- Press F11.
- Select 'Performance - Office.'
- Select 'Monitor' or 'Printer.'
- Select earliest date to include in the report.
- Select latest date to include in the report.
- Click on 'Produce Report.'
According to various measures, this report analyzes how much each office person has contributed.
The methodology is as follows:
- It reads in both your current and archived JobRecords, seeking to find all that may potentially have narrative history notes that fit within the date period you have specified for report inclusion.
- For each date-period-fitting note it finds, it parses the text to determine if it seemingly describes one of several different kinds of tallied events.
- If the text describes such an event, it looks further to see if it can extract a two-letter code that seems to designate an office person.
- If it can do the above, it tallies that note to a count of such events for that office person.
- It displays all resulting tallies in fashion.
You may notice two groups of listed office persons, with a gap in-between. Those in the first group are pulled from your current-at-the-moment "office-persons-roster" as maintained in your ServiceDesk Settings form. Those in the second group involve note entries with other office-person abbreviations (i.e., ones no longer in your current roster).